Three Middle East necks — Hormuz, Bab el-Mandeb, Suez/SUMED — carry oil, gas liquids, containers, and a third of seaborne fertilizer. Score them as valves, cascade cost from crude through every layer of production and transport, name the winners and losers, and measure the workarounds both major blocs are building.
INTERACTIVE · MATH·Cost cascade · W/L·stamped Aug 2026
Survival is a logistics problem before it is a political one. Calories and joules both move through water that narrows. When the water narrows enough, whoever holds the neck does not need to own the cargo — they only need to make passage conditional. That is choking: not the destruction of supply, but the ability to meter it.
Data window · public EIA / IEA / UNCTAD / IFPRI / trade press · last reconciliation 2026·08·04. Pre-crisis baselines use 2024–1H2025 averages; crisis observations use the 2026 Hormuz disruption as a live stress test, not a permanent equilibrium.
01The three necks
The Middle East does not have one chokepoint. It has a series: a primary exit from the Gulf, then a Red Sea corridor that is itself gated at both ends. Oil, LNG-adjacent liquids, containers, sulfur, urea, and ammonia share the same geometry even when they do not share the same ships.
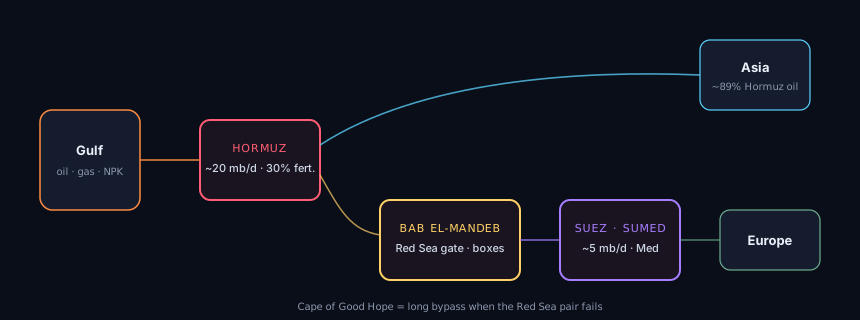
Three necks on two commodity families. Asia takes the bulk of Hormuz oil; Europe and the Med sit behind the Red Sea pair.
Neck 1 · Strait of Hormuz
The primary Gulf exit
Pre-crisis oil ~20 mb/d (~20% of global petroleum liquids consumption; >25% of seaborne oil). ~89% of Hormuz crude/condensate runs east to Asia — China alone ~38% of destination share in Q1 2025. Up to ~30% of globally traded fertilizer typically transits here; Gulf states supplied ~36% of urea and ~29% of ammonia exports (2023–25). LNG and sulfur ride the same geography. No full maritime substitute at scale.
Neck 2 · Bab el-Mandeb
Southern Red Sea gate
Oil ~4.2 mb/d in 1H 2025 after Houthi-era diversion (down from ~9.3 mb/d in 2023). When Hormuz tightens, this neck becomes the second chance for Saudi Red Sea loadings — and a second failure mode. ~12–15% of global seaborne trade and ~30% of container traffic normally use the Red Sea system. Fertilizer and grain share the box and bulk fleets that reprice when the gate is unsafe.
Neck 3 · Suez Canal + SUMED
Northern Red Sea gate
Crude and products via Suez + SUMED ~4.9 mb/d in 1H 2025. This is the short bridge from Asia–Gulf supply to Europe and the Med. When Bab el-Mandeb fails, Suez becomes an expensive museum and the Cape of Good Hope becomes the default — longer voyage, higher bunker burn, higher insurance, thinner fertilizer delivery windows into planting season.
Why fertilizer sits with oil. Nitrogen fertilizer is gas chemistry first: cheap Gulf natural gas → ammonia → urea. Phosphates and sulfur ride oil-and-gas logistics. So a maritime energy neck is also a crop-input neck. Choking fuel and choking next season’s yield are the same map with different cargoes.
02Valve math, not map math
A neck is only a choke if three conditions hold at once: little bypass, high concentration of the flow, and high switching cost. Write the recoverable fraction as bypass capacity over threatened flow:
βᵢ — how much of neck i can be rerouted without the waterway
Then the unrecoverable lost flow under a choke vector χ (χᵢ = 1 if neck i is closed or unusable, 0 otherwise) is:
ΔF* — physical shortage after every available bypass is already used
For system risk when necks can fail together — not independent coin flips, but a joint exposure — a useful lower-bound stress measure when failures are treated as non-offsetting is the product form on residual openness:
R — share of gated capacity that is still “at risk” after bypasses; 0 = fully relieved, 1 = fully exposed
Price does not move one-for-one with barrels. Short-run oil demand is inelastic. With demand elasticity ε ≈ 0.05–0.15 (magnitude), a fractional supply loss maps into a larger fractional price move, plus a risk premium ρ for insurance, war risk, and inventory scramble:
the inelasticity amplifier — small ΔQ*, large ΔP, then freight and risk on top
Food sits one derivative downstream. Energy enters farm machinery, irrigation, and processing; fertilizer enters yield; freight enters the landed cost of both:
the survival stack — food inflation as a weighted sum of energy, fertilizer, and freight shocks
Worked order of magnitude (illustrative, not a forecast). Pre-crisis Hormuz oil FH ≈ 20 mb/d. Realistic near-term bypass BH (Petroline + Fujairah + minor pipelines, after terminal constraints) ≈ 3–5.5 mb/d → βH ≈ 0.15–0.28. If χH = 1, then lost oil ≈ 14–17 mb/d before SPR draws and demand destruction. At ε = 0.1, a 5% global liquids shortfall is on the order of a ~50% price move before ρ — enough to reprice everything that burns or ships. Fertilizer: if ~25–30% of seaborne N-fertilizer is removed and βfert is near zero (no ammonia pipeline substitute at that scale), urea and ammonia print the shortage immediately into planting-season cost.
03What the 2026 stress test already showed
This is not only theory. In early 2026, military escalation around Iran collapsed Hormuz loadings from ~20 mb/d toward a trickle — IEA tracking put early-April loadings near ~3.8 mb/d versus >20 mb/d in February, with March global supply off by on the order of 10 mb/d. Fertilizer shipments outbound through Hormuz went effectively to zero on some trackers. That is the empirical definition of a valve: β was small, C was high, σ was catastrophic for shippers who waited for a second road that did not exist at scale.
Asia felt the crude shock hardest by destination share; importers of Gulf urea and ammonia felt the food-input shock regardless of whether they imported a single barrel. Europe felt Red Sea second-order effects whenever Bab el-Mandeb and Suez stayed risky: longer Cape routings, higher box rates, delayed intermediate goods — the same arithmetic that hit in 2024, re-armed.
04China–Russia consortium: build around the map
The Sino-Russian response is not “reopen Hormuz.” It is reduce dependence on waterways they do not control.
Arctic · NSR
Northern Sea Route
Russia–China joint development push (incl. late-2025 coordination to industrialize the Arctic corridor). LNG and oil from Yamal / Arctic projects to Asia; seasonal now, year-round ambition via icebreaker fleets. China designs its own nuclear icebreaker capacity rather than only renting Russian ice. NSR cargo remains far below Suez volumes — tens of millions of tons, not a full Hormuz substitute — but it is a politically gated alternative for select energy cargoes.
Energy · overland & swaps
Pipes, power of Siberia logic, barter
Pipeline gas and crude that never enter Hormuz; discounted Russian barrels into Chinese refining; settlement outside Western insurance and dollar-clearing stacks where possible. Iran’s China-bound crude (near-total destination concentration pre-war) is the extreme form of a bilateral energy circuit that treats the public chokepoint as optional when politics allow.
Insurance · fleet
Shadow logistics
Sanction-hardened tanker fleets, alternative insurance, ship-to-ship transfers, and flag/ownership opacity. These do not create new geography — they lower the cost of using hostile or ambiguous geography. When β is structural, actors invent β in law and finance instead.
Strategic intent
Exit the valve, don’t capture it
For Beijing, Hormuz risk is also Malacca risk by analogy: any single maritime gate is an unacceptable civilizational single point of failure. The consortium answer is route diversity under friendly sovereignty (Russian Arctic, continental pipes), not freedom of navigation sermons.
05NATO axis & Gulf partners: hold and bypass
The Atlantic system’s toolkit is the opposite sequence: keep the waterway open if possible; if not, surge every partial bypass that already exists; buy time with stocks; force shipping around Africa when the Red Sea pair fails.
Hard bypass · pipes
Petroline · Fujairah · Kirkuk–Ceyhan
Saudi East–West (Petroline) Abqaiq→Yanbu: multi-mb/d pipe capacity (surge claims toward ~7 mb/d) but export terminal and Red Sea risk cap effective relief. UAE Habshan–Fujairah (ADCOP) ~1.5–1.8 mb/d today, expansion toward doubling by ~2027. Iraq’s northern pipe is smaller and politically fragile. Honest combined near-term β on Hormuz oil: roughly one-seventh to one-quarter of pre-crisis flow — not a full spare lung.
Soft bypass · sea
Cape · escorts · SUMED
When Bab el-Mandeb/Suez are unsafe, Asia–Europe boxes and some energy go around the Cape (+10–14 days typical). Naval task groups and coalition escorts try to restore β by lowering risk rather than building steel. SUMED can still move crude across Egypt if both ends of the Red Sea can be reached — a conditional bypass, not a free one.
Stocks · demand
SPR · IEA collective · rationing
Strategic petroleum releases and coordinated stock draws convert inventory into temporary β. They do not grow fertilizer molecules. Demand destruction (industrial curtailment, driving less) is the brutal residual equalizer when ΔF* stays large.
Corridors · politics
IMEC · land bridges · Fujairah scale-up
India–Middle East–Europe corridor concepts, Gulf-to-Med land ideas, and permanent Fujairah capacity growth are attempts to raise structural β before the next crisis. They compete with the Sino-Russian Arctic story for the same prize: a map that is less hostage to three waterways.
06Other possibilities
Beyond the two bloc scripts, the residual case space is short and sharp:
Path
What it changes
Hard limit
Spare producers outside the Gulf
Raises non-choked Q
US shale, Brazil, Guyana, Canada help oil; they do not replace Gulf urea/ammonia at equal cost.
Iran Jask / eastern terminals
Partial Hormuz avoid for one producer
National, not regional, relief. Politics can close it as fast as steel opens it.
Green / blue ammonia elsewhere
Long-run β on fertilizer
Capex and time. Multi-year, not planting-season.
Demand collapse
Closes ΔF* by shrinking need
Recession is a “solution” only in the accounting sense.
Dual choke (Hormuz + Bab)
Destroys sequential backup
Saudi Red Sea exports and Cape-only Europe–Asia trade: worst joint geometry.
Insurance market freeze
Chokes without mines
Hull war-risk premia can empty a waterway while it is still physically open.
07Oil is the floor under every other cost
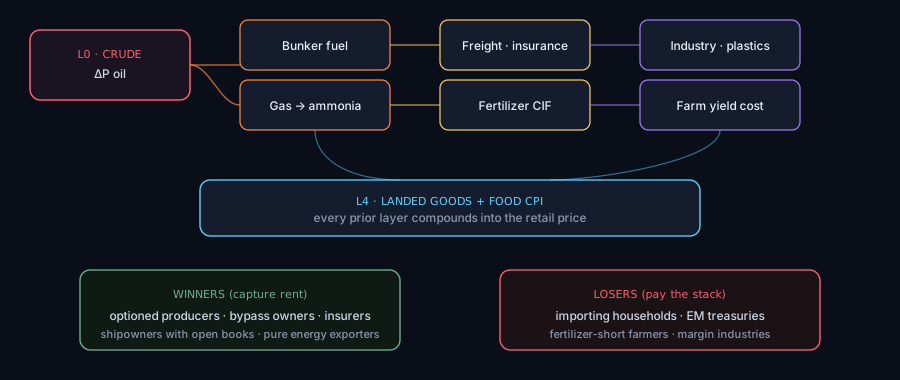
Oil is not one commodity among many. It is the energy and mobility substrate under extraction, synthesis, shipping, and last-mile delivery. A choke does not only raise the pump price. It rewrites the cost base of everything that moves or is made with heat, engines, feedstock, or freight. That is the cascade.
Every layer above L0 is a multiple of oil, gas, and voyage cost. Choking L0 taxes the entire stack — then redistributes the tax as rent to those with optionality.
Write the total incremental social cost over a crisis window τ as the sum of primary energy, freight, fertilizer, and second-order pass-through into finished goods:
four ledgers, one choke — do not stop at the oil price headline
08Extrapolated cost — the cascade in dollars
Use transparent anchors. Global liquids demand Q ≈ 100–103 mb/d. A baseline Brent-class marker P₀ ≈ $75–85/bbl (illustrative pre-shock band). Short-run elasticity |ε| ≈ 0.10. Hormuz-class lost flow after β ≈ 0.2 on 20 mb/d is ~16 mb/d raw; treating effective global shortfall after SPR and demand response as ~4–8% of Q in a severe month is conservative relative to 2026 tracking that saw ~10 mb/d supply collapse at peak. Price sketch: Δlog P ≈ (1/ε)·Δlog Q* + ρ. At 5% shortfall and ρ = 0.15, ΔP/P is on the order of ~65% — e.g. $80 → ~$130. That is a scenario number, not a forecast; the ledger below shows how costs scale once you pick a ΔP.
gross transfer through the oil market — who pays depends on who imports
Ledger
Mechanism
Order of magnitude (severe Hormuz month)
L0 · Crude bill
ΔOilBill ≈ Q · ΔP · 30d
At Q=102 mb/d and ΔP=+$50/bbl: ~$153B per month of gross market revaluation. Not all of that is “new cash” — inventory marks, futures, and term contracts reallocate — but importers’ marginal barrels clear at the new price.
L1a · Bunker / voyage
Fuel is ~30–50% of ship opex on long hauls; Cape adds ~10–14 days Asia–Europe
Cape diversion historically: +$200–400/TEU direct cost layers; Asia–Europe spot rates have printed +200–300% in acute Red Sea phases, later settling ~25–35% above pre-crisis. Tanker war-risk on hot waterways: voyage premiums from tens of thousands into $150k–$1M+ class for exposed hulls.
Crude +$50 typically maps to multi-tens of percent on naphtha-linked resins. Packaging, auto parts, textiles, and construction materials reprice with a lag of weeks to one quarter.
L2 · Fertilizer CIF
Gas → ammonia → urea; Gulf export share; near-zero β on molecules
Gulf ~36% urea / ~29% ammonia export share (2023–25). Hormuz stoppage: seaborne N-fertilizer can lose ~25–30% of trade. 2026 tracking: urea moves of +20–30%+ within weeks of closure. Planting-season importers (India, Brazil, E. Africa) eat CIF spikes immediately.
L3 · Farm & food
Δlog Food ≈ α·Δlog E + γ·Δlog Fert + κ·ΔFreight
With α≈0.25, γ≈0.35, κ≈0.15: a 50% energy-price index move + 30% fertilizer move + 25% freight move → food-cost index on the order of ~25–30% before subsidies. Yield loss appears 6–18 months later if farmers cut application rates.
L4 · Macro / fiscal
Import bill, subsidies, CPI, rate path
Rule of thumb from historical oil shocks: every sustained +$10/bbl can shave on the order of ~0.1–0.3 pp off global GDP growth depending on slack and policy (range, not a constant). Energy-importing EMs: dual hit — FX drain on crude and food/fertilizer subsidies. Central banks face “bad inflation” (supply) that rate hikes punish without restoring barrels.
Worked monthly transfer (transparent scenario). Assume ΔP = +$50/bbl for 90 days, Q = 102 mb/d. Gross oil-market revaluation ≈ 102e6 × 50 × 90 ≈ $459 billion over the quarter. Add container/tanker freight uplift: if 15% of world containerized trade faces +$300/TEU equivalent and ~15M TEU are affected in the window, that is only ~$4–5B direct — small next to oil, but it hits manufactured goods margins and inventory carrying cost. Add fertilizer: if 10 Mt of urea-equivalent trade is repriced +$150/t, that is ~$1.5B direct on molecules — small in dollars, large in calories for import-dependent regions. The hierarchy is clear: oil dollars dominate the macro bill; fertilizer and freight dominate the survival bill.
Why “oil at the bottom” multiplies. Diesel moves grain to port. Bunker moves grain across oceans. Natural gas (priced in a world oil/gas complex) makes ammonia. Trucks, cold chain, plastics packaging, and retail logistics all burn refined products. A 1% rise in oil does not raise CPI 1% — but a discontinuous oil event raises many CPI components at once, which is why choke inflation feels universal: it is.
09Winners and losers — specifics
Every choke is a transfer. The price that one side pays is revenue, option value, or political leverage for another. Below is not moral scorekeeping — it is the cash-flow map.
09aWinners (capture rent or strategic position)
Who
Why they win
Specific channel
US shale & Western Hemisphere crude (US Lower 48, Guyana, Brazil, Canada heavy)
Barrels that never needed Hormuz clear into a higher global marker
Producer netbacks rise with Brent/WTI. Drillers, midstream (Permian pipes), and service companies (pressure pumping, frac sand) capture volume × margin if policy allows export growth.
Saudi Arabia & UAE with bypass steel
Partial β while peers choke
Petroline→Yanbu and Habshan→Fujairah keep a fraction of exports alive at crisis prices. Every barrel that still loads earns the elevated marker; peers without pipes do not. Capex to expand Fujairah is a bet on permanent optionality rent.
Russia (pipeline + Arctic + discount Asia)
Non-Hormuz routes; Asia needs replacement crude
ESPO/pipeline and Arctic/NSR-linked cargoes gain strategic value when Gulf seaborne oil fails. Discount may narrow if China/India scramble — rent shifts from buyer to seller.
Non-Gulf fertilizer exporters (Russia, China when exporting, Morocco phosphates, US/Canada where spare)
Gulf N-export hole
Urea/ammonia FOB outside the Gulf reprices upward. Moroccan phosphate and traders with inventory mark gains. Domestic producers in India/Brazil with gas access gain margin vs imports.
War-risk insurers & P&I specialty capital
Premia explode while physical passage is still “possible”
Red Sea/Gulf war-risk can jump from ~$10–20k/voyage-class norms into $150k–$500k+ (and higher for large tankers). Underwriters who stay on risk collect; those who exit force cargo onto Cape and still reprice global hull markets.
Ocean carriers with spare ships (container alliances, VLCC owners)
Ton-mile demand rises when routes lengthen
Cape adds voyage days → effective fleet shrinks → freight rates rise. Owners who did not scrap in the downturn earn windfall on Asia–Europe and tanker TCEs. Ports on alternate hubs (e.g. Western Med, some African bunkering nodes) see call growth.
Defense contractors & naval logistics
Escorts, munitions, basing, ISR
Sustained chokepoint crises fund destroyer/ replenishment ops, missile defense, and regional basing. Budget lines follow task groups — a fiscal transfer from taxpayers to MIC primes.
Refiners with advantaged crude access
Crack spreads can widen if product is short and crude slate is available
USGC and some Asian refiners who secure non-Gulf crude may run hard into product exports. Conversely, Gulf refiners cut off from export outlets lose — see losers.
Holders of optionality infrastructure
β itself is an asset
Fujairah storage/bunkering, SUMED equity logic, SPR managers who sell into spikes, and trading houses (Vitol, Trafigura, Gunvor, etc.) with ships + storage + credit earn the volatility premium.
09bLosers (pay the stack)
Who
Why they lose
Specific channel
China (refining system)
~38% of Hormuz crude/condensate destination share (Q1 2025 class)
Largest single absolute exposure to Hormuz oil by destination. Independent teapot refiners and coastal majors face feedstock cuts, run cuts, and product shortfalls. Strategic petroleum helps days, not quarters. Food-input risk via imported urea/ammonia competition.
India, Japan, South Korea, ASEAN importers
High Gulf crude dependence; India also major urea importer
India: dual shock — crude import bill and fertilizer subsidy bill. Japan/Korea: industrial energy and petrochem feedstock. Current-account and FX pressure; political premium on any non-Gulf barrel.
Europe (esp. manufacturing + households)
Red Sea pair is the short Asia link; energy still globally priced
Even with less direct Hormuz crude share than Asia, Europe pays global oil marker + Cape container inflation on imports from Asia (autos parts, electronics, chemicals). Industrial margins compress; ECB faces sticky goods inflation.
Gulf producers without usable bypass (Kuwait, Qatar seaborne, much of Iraq southern export, Bahrain)
F trapped behind Hormuz
Revenue collapse on unexported barrels even as global price spikes — the cruelest outcome: high price, no liftings. Qatar LNG/ammonia logistics disrupted. Fiscal break-evens missed; sovereign funds draw or projects freeze.
Egypt (Suez Canal Authority)
Transit fees are the product
When Bab el-Mandeb fails, Suez volumes collapse. Billions in annual FX receipts at risk (order: multi-$B/year historically at full utilization). Tourism and Suez-adjacent services follow cargo.
Import-dependent farmers (India smallholders, Brazil soy/corn belt on imported urea, E. Africa, parts of SE Asia)
Fertilizer CIF + diesel for pumps/tractors
Cut application → yield loss next harvest. Or buy expensive N → working-capital crisis. Net importers of calories later pay twice.
Net food-importing low-income states
Food CPI is the tax on the poor
Wheat, rice, edible oils land higher via freight + fertilizer-driven export restrictions abroad. Subsidy budgets explode or hunger metrics worsen — the survival end of the cascade.
Jet fuel and diesel track refined product cracks upward. Thin-margin converters cannot pass through fully → margin compression, plant curtailments, layoffs in energy-intense verticals.
Households in oil-importing economies
Fuel + food + goods
Real income falls. Regressive: lower quintiles spend higher shares on energy and food. Political instability risk is a lagging indicator of L4.
Iran (if under blockade / war while China demand wobbles)
99%+ of pre-war crude was China-bound; strait is home water
Can try to tax the strait — but also can lose export revenue and domestic product logistics if the fight closes its own arteries. Winning the toll and losing the customer is possible at once.
09cAmbiguous / conditional positions
Who
Win if…
Lose if…
China (state strategy)
Accelerates Russia pipes, NSR, strategic stocks, domestic coal-to-chem; locks long-term equity in non-Gulf supply
Prolonged Hormuz closure before alternatives scale — industrial stall and food-input stress
United States
Net petroleum exporter status + shale + financial claim on global oil price; defense contractors
Global recession demand destruction; allies destabilized; fertilizer/food inflation hits voters; naval cost of open-strait policy
Bypass works and price stays high on remaining barrels
Yanbu/Red Sea also threatened (dual choke); spare capacity unused; long war damages infrastructure
The transfer identity. Someone’s ΔP is someone else’s margin. Roughly: elevated oil markers transfer income from net importers (Asia EM households, European industry, African treasuries) to net exporters with open liftings (US shale, SA/UAE bypass barrels, Russia non-Gulf routes). Elevated freight transfers from cargo owners to shipowners and insurers. Elevated fertilizer transfers from farmers and food consumers to non-Gulf nutrient exporters and traders. Choking does not destroy value first — it reassigns it along the optionality gradient. Destruction comes later, when yield fails and plants stay cold.
10Play the numbers
The instrument below is a transparent calculator, not an oracle. Set each neck’s open/closed state, tweak bypass fractions and short-run elasticity, and read lost oil, a price-move sketch, fertilizer exposure, an extrapolated cost cascade in dollars, and a winners/losers stress split. Defaults are stamped to the August 2026 public baseline. Change them when the world does.
First: Hormuz is the only neck whose single-point β is still catastrophically low relative to the flow it gates. Pipelines help; they do not replace twenty million barrels and a fertilizer fleet.
Second: Bab el-Mandeb and Suez are a coupled pair. Opening one while the other is closed does not restore the Asia–Europe short path. The Cape is time, fuel, and cost — and those are winners’ fees for shipowners and insurers.
Third: oil dollars dominate the macro bill; fertilizer and freight dominate the survival bill. A $459B quarterly oil revaluation and a $1.5B urea reprice are different units of power — one moves GDP and FX, the other moves harvests and hunger.
Fourth: winners are those with optionality — non-Gulf barrels, bypass pipes, spare ships, war-risk books, defense tasking. Losers are those with obligation and no route — Asia’s Hormuz-dependent refiners, fertilizer-importing farmers, Suez fee revenue, households in importing states.
Fifth: both blocs are solving for β, not for poetry. China–Russia buy geography they can police. The NATO axis and Gulf partners buy open water, partial pipes, stocks, and longer seas. Neither abolishes the three necks this decade. Both admit, by capital budgets, that survival runs through logistics that can be choked — and that every choke is a transfer from the route-poor to the route-rich.