A national inflation rate is an average over households that do not exist. Nobody buys the CPI basket. In 2025 a family in the bottom tenth spent 55.6% of its budget on food and housing; the tenth just above it spent 56.9%; a family in the top tenth spent 40.5%. When prices move unevenly, the same month is a different month depending on where you stand — and a single number cannot say who is falling behind.
Data window · BLS Consumer Expenditure Survey 2025 decile shares and income before taxes · BLS CPI-U monthly index levels Jan 2018 – Sep 2026 · FHFA HPI Aug 2026 · Freddie Mac PMMS Oct 29 2026 · paycheck: Census household income 2025, BLS usual weekly earnings Q3 2026, SSA wages 2023, IRS Rev. Proc. 2025-32, USDA food plans Dec 2025, HUD FY2026 fair market rents, EIA gasoline Nov 2 2026, FHWA Highway Statistics 2024 · reconciled 2026·11·04
01Three measurements, not one
The inquiry starts by refusing to treat the published figure as everyone’s experience. It builds three measurements and reconciles them against each other.
02Two different ways a group can face more inflation
Basket composition. Lower-income households devote more of their budgets to necessities; higher-income households more to discretionary spending. Identical price changes then produce different rates. Prices actually paid. Households also shop at different stores, buy different brands, live in different housing markets, and borrow on different terms. BLS states that its experimental income-quintile indexes capture the first effect far more fully than the second. Neither does this model — yet.
The first effect is pure arithmetic. Suppose food rises 10% and everything else 2%:

03The model
Split households into ten income deciles. For each group g, hold its baseline basket fixed and price it forward:
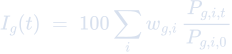
A fixed basket isolates price change from changes in quantity: it answers how fast is the cost of keeping this group’s existing standard of living rising? A changing-basket version can be added later to measure substitution. In this version, the price term is the national CPI category index — the same for every group — so every difference between deciles comes from the weights.
The weights are BLS Consumer Expenditure Survey shares for 2025 across seven categories: food, housing, transportation, healthcare, entertainment, personal care, and miscellaneous. These cover 88.4% of the bottom decile’s outlays and 70.2% of the top decile’s. The remainder — insurance and pensions, education, apparel, cash contributions — is charged the headline rate. The 2022 shares, which the first version of this model used, stay in the lab as a vintage:

04September 2026: the fuel year
Twelve months to September 2026, CPI-U rose 3.7%. Underneath, energy rose 20.4% and motor fuel 34.9%, pushing transportation to +7.9%. Food (+2.5%) and housing (+3.3%) — the categories that dominate low-income budgets — ran below the headline.
| Decile | Food + housing | Transport | Coverage | Inflation | vs CPI |
|---|---|---|---|---|---|
| Bottom 10% | 55.6% | 15.9% | 88.4% | 3.80% | +0.10 |
| 10–20% | 56.9% | 14.7% | 90.3% | 3.70% | 0.00 |
| 20–30% | 55.0% | 15.2% | 87.0% | 3.75% | +0.05 |
| 30–40% | 52.9% | 16.1% | 85.8% | 3.81% | +0.11 |
| 40–50% | 50.9% | 16.9% | 83.9% | 3.86% | +0.16 |
| 50–60% | 48.2% | 18.6% | 82.0% | 3.96% | +0.26 |
| 60–70% | 46.7% | 18.5% | 81.4% | 3.96% | +0.26 |
| 70–80% | 45.2% | 16.7% | 78.1% | 3.90% | +0.20 |
| 80–90% | 44.0% | 17.4% | 75.8% | 3.96% | +0.26 |
| Top 10% | 40.5% | 14.8% | 70.2% | 3.90% | +0.20 |
The modeled range is 3.70% to 3.96%. Three groups tie for the hardest hit — the 50th–60th, 60th–70th, and 80th–90th percentiles — all at 3.96%. The lightest is the 10–20% group, at the headline, because it puts the most of its budget into food and housing and the least into transport. Hold transport at the headline and the order flips: the bottom decile falls to 3.13% and the top sits at 3.27%.
05Seven years of real prices
One month proves little. The lab replays every month from January 2019 to September 2026 using the actual BLS index levels for all eight series, applied to the same baskets. Track one number — the bottom decile’s rate minus the top decile’s:

| Period | What led prices | Average Δ | Range |
|---|---|---|---|
| 2019 | Calm; shelter steady | +0.16 | +0.10 … +0.21 |
| 2020 | Gasoline collapses, food rises | +0.23 | +0.11 … +0.38 |
| 2021 | Used cars, fuel rebound | −0.16 | −0.31 … +0.15 |
| 2022 | Fuel peak, then food and shelter | −0.03 | −0.23 … +0.23 |
| 2023 | Food and shelter, fuel deflating | +0.18 | +0.04 … +0.30 |
| 2024 | Shelter leads | +0.16 | +0.10 … +0.23 |
| 2025 (11 months) | Shelter leads | +0.15 | +0.10 … +0.21 |
| 2026 (Jan–Sep) | Energy shock | 0.00 | −0.10 … +0.15 |
In 70 of 92 published months the bottom tenth faced more inflation than the top tenth. The gap peaked at +0.38 percentage points in May 2020 and at −0.31 in June 2021. On the 2022 baskets the same prices still reach 0.61 points, in May 2020: the bottom decile’s food share has since fallen from 17.2% to 14.0%, so the same grocery shock moves it less. At the June 2022 peak — 9.1% headline — the hardest-hit groups were the 50th–70th percentiles at 10.0%, and the bottom decile ran 9.5%. The bottom decile’s worst relative stretch came after the peak, in 2023, when fuel deflated and groceries and rent kept climbing. Compounded from January 2019 to September 2026, prices rose 33.9% on the headline index and between 35.6% (top decile) and 36.3% (50th–60th percentile) on the 2025 baskets. The bottom decile compounded 36.2%.
06Purchasing power: who falls behind
A group loses purchasing power when its income grows more slowly than its own inflation rate:

The model gives each decile a break-even for whatever price scenario is on screen. In September 2026 the bottom decile needed at least 3.80% nominal income growth to stand still, and the three groups at 3.96% needed that. One month is a stress test. The matched record is six years of income for the same ten deciles.
That record is the Consumer Expenditure Survey’s mean income before taxes, calendar 2019 through calendar 2025, the same brackets as the baskets. After-tax income is the closer measure of what a household can spend, and BLS publishes it through 2023. For 2024 and 2025 the after-tax series is absent, because the tax model was not updated. The full window uses before-tax income. Price change over the window is the basket in the figure, which opens on the 2025 weights, priced with annual-average CPI. October 2025 was never published, so the 2025 average uses the other eleven months.
Each bar is one income decile. Real income divides the income BLS recorded by that decile’s own basket. Dollar change is the same recorded income in dollars, so it stays put when the basket changes.
The six-year window
| Decile | Income 2019 | Income 2025 | Nominal | Basket inflation | Real income | Dollar change |
|---|
Each year · real before-tax income
Every decile’s real before-tax income rose. The bottom tenth rose 28.6%. The top tenth rose 2.5%. Basket inflation sat between 27.3% and 27.9% — a 0.6 point spread — while nominal income growth ran from 30.4% at the top to 64.5% at the bottom. The spread in basket inflation is 0.62 points. Over this window, income growth is what separated the brackets.
Dollars run the other way. The bottom tenth’s mean rose by $4,043. The top tenth’s rose by $89,562. A larger percentage of a much smaller income is still a smaller amount of money.
Each year’s decile is whoever was in it that year. A family that earned its way out of the bottom tenth is replaced by another. The 28.6% is the change in the income BLS records for that bracket. In 2025 the bracket reports $10,311 of income before taxes and $35,986 of spending, so the recorded income is a fraction of the budget the basket is built on.
The six-year gain hides 2021. That year every decile lost real income. The bottom lost 7.6% and the top lost 2.4%. In 2022 the bottom’s income caught up, +3.5% real, while nine deciles were still behind. In 2024 the top tenth’s mean before-tax income fell and its real income fell 4.6%. It reversed in 2025, +7.8%.
Where after-tax income exists, 2019 through 2023, the direction matches. The bottom tenth’s real after-tax income rose 17.6%. The top tenth’s was −0.4%. The bottom’s after-tax mean sits above its before-tax mean, which is the CE tax estimate picking up refundable credits.
That chart prices the bracket BLS records. The next section prices one wage against a city rent, food for four, and gasoline.
07A paycheck, priced
In 2023 the Social Security Administration counted 173,670,935 wage earners. Through the interval that ends at $69,999.99, the cumulative share is 71.47%. The median net compensation that year was $43,222.81. Full-time wage and salary workers are a smaller group with higher usual earnings: in the third quarter of 2026 the median was $1,232 a week, which is $64,064 over 52 weeks. A household can hold more than one of those earners. Census Table 6 for 2025, household money income in 2025 dollars, puts the 40th percentile at $68,600, the median at $87,460, and the 60th percentile at $110,300.
A $70,000 wage, single filer, tax year 2026, owes $6,570 of federal income tax after the $16,100 standard deduction and $5,355 of employee Social Security and Medicare tax. The paycheck is $58,075. The same wage on a joint return with one earner owes $4,040 of federal income tax and the same $5,355, and the paycheck is $60,605. The employer owes a matching $5,355 on top of the wage. On the $64,064 median the single paycheck is $53,655 and the joint one-earner paycheck is $55,835. The distance from the $58,075 paycheck to $50,000 of cash is $8,075. That is the amount state income tax and sales tax would have to collect to land there, and those taxes differ by state. This page leaves them uncomputed.
HUD’s fiscal 2026 fair market rent is the 40th-percentile gross rent, utilities included. The two-bedroom figure is $2,910 in the New York HUD metro, $2,903 in Los Angeles County, $1,931 in Dallas, and $1,573 in Houston. A $2,700 two-bedroom sits above Dallas and Houston and below Los Angeles and New York. Inside a metro the zip-code rents run on either side of the metro figure. Houston’s own release publishes zip-code two-bedrooms of $2,360.
USDA’s December 2025 moderate-cost food plan, all meals and snacks prepared at home, prices a four-person household — a man and a woman age 19–50, a child 6–8, and a child 9–11 — at $1,347.20 a month. That is $44.29 a day and $16,166 a year. The liberal plan for the same household is $1,628.40 a month, $53.54 a day. Fifty dollars a day is $18,250 a year and sits between those two plans. Restaurant meals sit outside both.
FHWA Highway Statistics 2024 records 3,294,031 million vehicle-miles and 239,824,944 licensed drivers. Dividing the first by the second and rounding to the nearest mile gives 13,735 miles per licensed driver, and that quotient hands truck and bus miles to drivers along with cars. A short-wheelbase light-duty vehicle averaged 10,812 miles and 25.6 miles per gallon. At the November 2, 2026 U.S. regular gasoline price of $4.153 a gallon, 13,735 miles costs $2,228. At $4.50 a gallon the same miles cost $2,414, and two such drivers cost $4,829. Four thousand five hundred dollars at $4.50 a gallon is 1,000 gallons. At 25.6 miles per gallon that is 25,600 miles.
On the $53,655 single paycheck, the Houston rent, the moderate food plan, and the $2,228 of gasoline leave $16,385 for the year. The same food and gasoline with the New York rent leave $341. Los Angeles leaves $425. Dallas leaves $12,089. A $2,700 rent, food at $50 a day, and 13,735 miles at $4.50 leave $591. The same rent and food with 25,600 miles, which is $4,500 of fuel, spends $55,150 and leaves the paycheck $1,495 short. State income tax, health insurance, a car payment, and childcare are still ahead of whatever remains.
The paycheck is the wage minus federal income tax and employee FICA. Left is that paycheck minus a year of rent, food, and gasoline. Employer FICA is shown on top of the wage and is kept out of the subtraction.
Federal income tax is the annual liability after the 2026 standard deduction. Employee FICA is 6.2% up to the Social Security wage base of $184,500 plus 1.45% Medicare on all wages. The 0.9% Additional Medicare Tax starts at $200,000 of wages for a single filer and $250,000 on a joint return. Withholding can move a few dollars between paychecks. The annual liability is the figure in the readout. Food uses a 365-day year. The moderate day, $1,347.20 × 12 / 365, is $44.29.
Federal paycheck · tax year 2026
| Wage | Filing | Federal income tax | Employee FICA | Paycheck | Employer FICA, on top |
|---|---|---|---|---|---|
| $64,064 | Single | $5,508 | $4,901 | $53,655 | $4,901 |
| $64,064 | Joint, one earner | $3,328 | $4,901 | $55,835 | $4,901 |
| $70,000 | Single | $6,570 | $5,355 | $58,075 | $5,355 |
| $70,000 | Joint, one earner | $4,040 | $5,355 | $60,605 | $5,355 |
What $53,655 covers
| Case, single filer | Rent | Food | Fuel | Left |
|---|---|---|---|---|
| Houston · moderate food · $4.153 · 13,735 mi | $18,876 | $16,166 | $2,228 | $16,385 |
| Dallas · same food and fuel | $23,172 | $16,166 | $2,228 | $12,089 |
| Los Angeles · same food and fuel | $34,836 | $16,166 | $2,228 | $425 |
| New York · same food and fuel | $34,920 | $16,166 | $2,228 | $341 |
| $2,700 · $50/day · $4.50 · 13,735 mi | $32,400 | $18,250 | $2,414 | $591 |
| $2,700 · $50/day · $4.50 · 25,600 mi | $32,400 | $18,250 | $4,500 | −$1,495 |
08The cost of becoming an owner
Consumer inflation does not measure how much harder it becomes to acquire a home, a business, farmland, or financial assets. Those acquisition costs govern wealth accumulation and mobility, so they get their own index rather than being mixed into the consumer basket. The first is the monthly cost of buying a house:

| Illustrative $400k house, 20% down | A year earlier | Now |
|---|---|---|
| Home price (FHFA +2.4%) | $400,000 | $409,600 |
| 30-year fixed rate (Freddie Mac) | 6.17% | 7.24% |
| Monthly principal & interest | $1,954 | $2,233 |
| Income needed at 28% of gross | $83,729 | $95,706 |
| Change in monthly entry cost | +14.3% |
The FHFA price window (August to August) and the mortgage-rate window (October to October) are not matched, so this is a financing stress test rather than a matched-time housing index. It excludes taxes, insurance, HOA dues, and closing costs. The direction is unambiguous anyway: the income required to enter rose by $11,977 in a year in which CPI rose 3.7%.
09Run the model
The purchasing-power figure draws the 2019–2025 income record and recomputes real income when the basket vintage changes. The paycheck figure prices one wage against rent, food, and fuel. The lab sets category price changes or a scenario, switches the same 2025 and 2022 baskets, and rebuilds the decile bars from their category contributions. Replay the 92 published months. A separate slider still tests a hypothetical growth rate against the scenario on screen. Stress the home-purchase inputs, or start logging matched prices of your own.